Hi, my name is Ashrit, and this is a timeline of the projects I have completed this semester!
Project 0A:
In this project, Jon and I, worked together to make a pinhole camera, but not just an ordinary one! We wanted to make one that could adjust its focus by sliding windows. We did this by having two frames that light has to pass through to enter, before hitting the film. We used the equation N=ƒ/D, where ƒ is the focal length, and D is the aperture of the pinhole camera to experiment with how we could do this design.
Project 0B:
For this project, I worked with King to learn how to use the PIL library in Python to generate some interesting-looking graphs that represent the Mandlebrot set. This equation can be used to represent it: Zn+1 = Zn2 + C.
The code is shown below where we use the PIL library to import different and there are two functions to generate different madelbrots and display them :
Below are some of the images that we generated:
Project 1:
In Project 1, I worked with Mathus and Delaney to represent probability distributions, through bracelets and beads. The three we wanted to represent were:
Binomial Distribution:
Poisson Distribution:
Geometric Distribution:
The bracelets are shown below:
Poisson:
Geometric distribution:
Binomial Distribution:
Project 2:
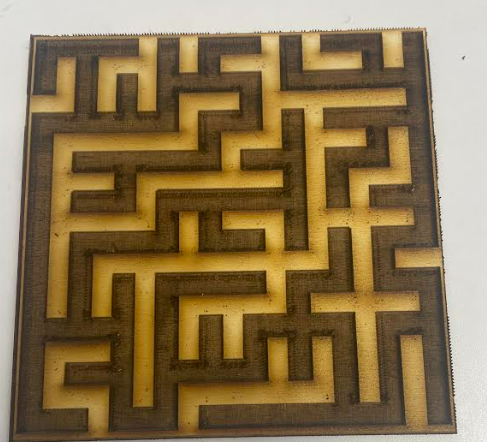
In Project 2, I worked with Tia to create 3D representations of mazes that Prof. Kagey discussed in class. The first design was shown to us by Prof. Kagey was made in Mathematica as shown below:
Each maze only has one complete exit, so we recreated this on wood using the wood printer:

Project 3:
For Project 3, I worked with Ambika to make represent fibonacci numbers, more specifically the fibonacci spiral:
Each rotation is of 137.5 degrees. We attempted to display this using a new technology we learned on the first day of class – openScad. We then decided to use a powder printer to display our idea.
Leave a Reply